
Culinary decline
A project where I transform numbers into infographics.
Concept
During my coding elective I learned how to work with R. For my plus plan project I wanted to create a series of posters using real and reliable statistics from the horeca branche. I reached out to different restaurant owners to talk about their experiences and hardships.
Following these talks, I went on the hunt for statistics and numbers. Profit losses in particular, but roaming through these restaurants I realized the decline isn’t in profits or clientele. It’s also in their visual appearance.
Data
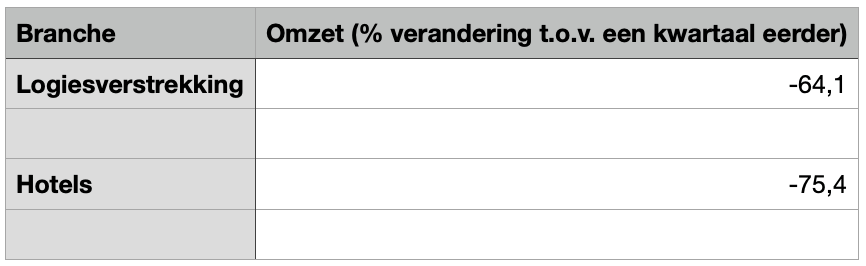
The restaurant business is one of the most looked at branche when it comes to the covid crisis in the Netherlands. According to CBS, the profits declined more than 50% in the second quarter of the year 2020 in comparison with the first in which profits declined with 14%. The first hit came in April of that year.


Data conclusion
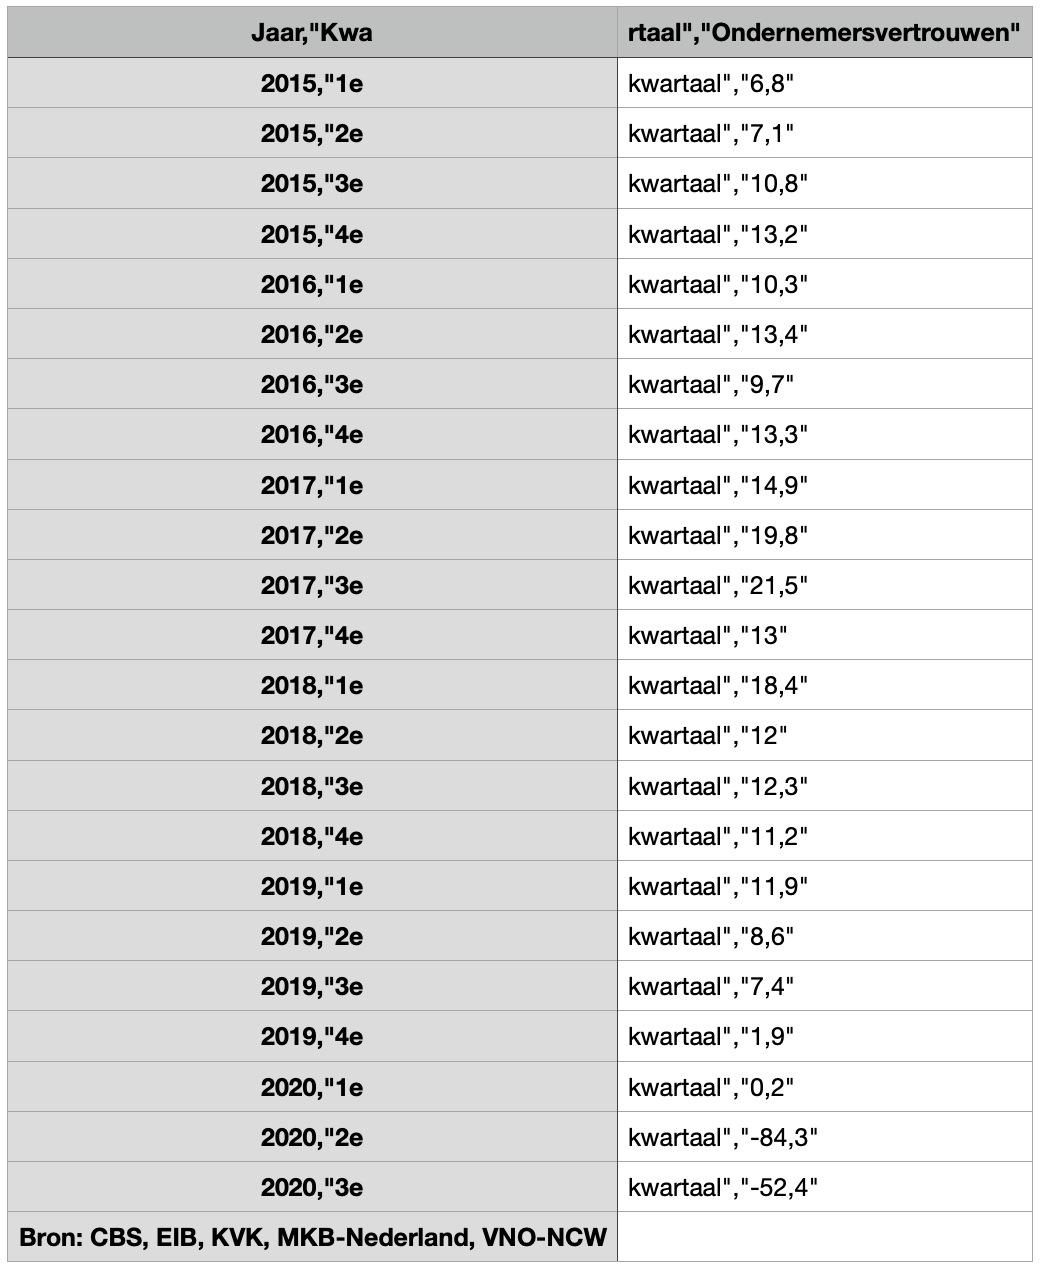
Closing restaurants for an extended period of time will result in more problems which would not help the crisis any. Declining mental health, debt, decrease in business confidence and a rise in unemployment numbers will follow.
How can we combat this?
The only way we can prevent this is if the government doesn’t drag restaurants on the chopping block. Closing the restaurants made the R-numbers soar cause people will meet at home with more than the limit amount of visitors. The restaurants helped in the sense of regulating the amount of people at a table or in a meeting.
Design
I really enjoyed working with data and processing, it was a great challenge trying to learn this skill within three weeks, including the two weeks from my elective.
I discovered it is way nicer to work with a schedule and with a clear central question and idea. The feedback helped me forward whenever I struggled.
Overall I found these few weeks very educational, I learned a lot of different things, like working with data and coding with different programs.


“R” and coding
Below you will find sketches, idea’s and the eventual codes leading up to the visualized data.


